Backend for kivy in matplotlib, first steps
A backend in matplotlib is a class that creates a link between matplotlib and any frontend framework in which the data can be rendered. Matplotlib provides a template which works as an excellent starting point for anyone who would like to develop a backend. It is a class which by itself works as a backend but do nothing. The very first thing I have been doing the last three days is reading the comments on this file and analyzing how backends for other frameworks are implemented.
The first objective towards implementing a fully functional backend in kivy is to write one with a canonical renderer such as Agg. The first class I modified from the list of classes that the file provides is FigureCanvas which I renamed FigureCanvasKivyAgg. This class extends from a FigureCanvasAgg and a Kivy Widget. The reason why it extends from FigureCanvasAgg is because this class returns an Agg renderer which will contain the graphical information of the graph. Additionally, it extends from Widget because it is handy to add a widget when someone wants to embed matplotlib graphs or use it with pyplot to provide a fully functional App.
 python ../../../examples/mpl/test_plt.py -dmodule://backend_kivy
In FigureCanvasKivyAgg two methods were overridden. The first one is draw which defines the context in which the renderer will be placed. From the FigureCanvasAgg I get the rgba buffer in order to place that in a texture which can be then added to a widget, as you can see in the following snippet.
texture = Texture.create(size=(w, h))
texture.blit_buffer(buffer_rgba, colorfmt='rgba', bufferfmt='ubyte')
texture.flip_vertical()
with self.canvas:
    Rectangle(texture=texture, pos=self.pos, size=(w, h))
The second method is blit, in which given a bounding box defines the rectangular area of the graph to be drawn.
self.blitbox = bbox
FigureCanvasKivyAgg can be embed in any Kivy application given it is a Widget
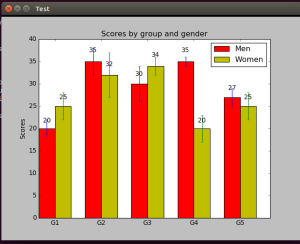
Matplotlib graphs can be embed or run as kivy application. Pyplot is the responsible to allow the total independence from the way the information is visualized. This is an example code in which no single line with kivy is shown. However, internally will create and run an App:
import matplotlib
#matplotlib.use('module://../../kivy/ext/mpl/backend_kivy')
import numpy as np
import matplotlib.pyplot as plt

N = 5
menMeans = (20, 35, 30, 35, 27)
menStd = (2, 3, 4, 1, 2)

ind = np.arange(N)  # the x locations for the groups
width = 0.35       # the width of the bars

figure, ax = plt.subplots()
fig1 = plt.gcf()
rects1 = ax.bar(ind, menMeans, width, color='r', yerr=menStd)

womenMeans = (25, 32, 34, 20, 25)
womenStd = (3, 5, 2, 3, 3)
rects2 = ax.bar(ind + width, womenMeans, width, color='y', yerr=womenStd)

# add some text for labels, title and axes ticks
ax.set_ylabel('Scores')
ax.set_title('Scores by group and gender')
ax.set_xticks(ind + width)
ax.set_xticklabels(('G1', 'G2', 'G3', 'G4', 'G5'))
ax.legend((rects1[0], rects2[0]), ('Men', 'Women'))

def autolabel(rects):
# attach some text labels
for rect in rects:
height = rect.get_height()
ax.text(rect.get_x() + rect.get_width() / 2., 1.05 * height, '%d' %
int(height), ha='center', va='bottom')

autolabel(rects1)
autolabel(rects2)

plt.draw()
plt.show()
Pyplot looks for a method in the backend call new_figure_manager in this method a figure is created with the information coming from the main app, in the case above figure. Once Figure created a FigureCanvas is created and in this instantiation and application is setup. All this happens until plt.draw(), which calls the draw method in FigureCanvas. Finally to run the app with plt.show() is needed to overwrite the show function in the FigureManager and send the app to run.
For the complete file you can check the code on github. This is the branch where implemented:
Nice work. Great to see someone is working on matplotlib integration for kivy, that is highly useful and a great feature.
Awesome, thank you for the great work.
how do I make it work with real-time and multiscreen? any good references,
I am working on image processing which requires Kivy to work on the front end numpy and matplotlib support it.
this post was helped me a lot …